The Uncomfortable Truth
Construction still accounts for over 30% of all workplace fatalities globally, according to the International Labour Organization (ILO). Yet most HSE teams continue to measure safety by counting injuries after they happen. In 2026, the question is no longer whether to track leading indicators. It’s which ones actually move the needle before someone gets hurt.
The Problem with Rearview-Mirror Safety
For decades, the construction industry has relied on lagging indicators – Total Recordable Incident Rate (TRIR), Lost Time Injury Frequency Rate (LTIFR), and fatality counts – as the primary yardstick for safety performance. These metrics are essential for compliance and benchmarking, but they share a fundamental flaw: they only confirm that your controls have already failed.
A site with zero recorded injuries last quarter may still harbour dozens of unresolved hazards, poor permit compliance, and undertrained workers. Without proactive safety management, HSE managers are flying blind between incidents – reacting to crises instead of preventing them.
Research from the Campbell Institute at the National Safety Council found that organisations with established leading indicators programmes experienced an average 77% reduction in incidence rates over a three-to-twelve-year period. That is not incremental improvement – it is a transformation in how safety outcomes are shaped.
Leading vs lagging KPIs
A KPI (Key Performance Indicator) is a measurable signal that helps you execute your OSH (Occupational Safety and Health) strategy and continuously improve performance.
Lagging KPIs measure outcomes that already happened (for example: injury counts, lost-time rates, fatalities). They are valuable for reporting and benchmarking but they are reactive by nature.
Leading KPIs are proactive, preventive measures that shed light on whether safety activities and controls are being performed effectively (for example: hazard response time, training completion, risk assessment quality, critical control verification).
10 Leading Indicators Every HSE Manager Should Track in 2026
The following ten construction safety KPIs represent a balanced mix of systems-based, behaviour-based, and organisational indicators. Together, they give HSE managers a real-time dashboard of site safety health – before incidents occur.
| # | Leading Indicator | What It Measures | Why It Matters |
|---|---|---|---|
| 1 | Near-Miss Reporting Rate | Volume & quality of near-miss reports | Hazard awareness culture |
| 2 | Safety Training Completion Rate | % of workforce with current certifications | Competency readiness |
| 3 | Toolbox Talk Frequency | Talks conducted vs. planned | Daily risk communication |
| 4 | Hazard Identification & Close-Out Time | Days from identification to resolution | Corrective action speed |
| 5 | Behavioural Safety Observation Rate | Observations per supervisor per week | At-risk behaviour detection |
| 6 | PPE Compliance Rate | % of workers using required PPE correctly | First-line defence effectiveness |
| 7 | Safety Audit Completion Rate | Planned vs. completed audits | Systemic risk oversight |
| 8 | Permit-to-Work Compliance | % of high-risk tasks with valid permits | Procedural control integrity |
| 9 | Worker Fatigue & Wellness Index | Hours worked, rest compliance, wellness flags | Human factor risk |
| 10 | Emergency Drill Effectiveness Score | Drills completed, response time, debrief quality | Crisis readiness |
1. Near-Miss Reporting Rate
Near-miss reporting is the single most powerful predictor of future incidents. A high reporting rate signals a workforce that trusts the system enough to flag hazards without fear of blame. Conversely, a drop in near-miss reports rarely means a site has become safer & it usually means workers have stopped reporting.
What to measure: Number of near-miss reports submitted per 100 workers per month, broken down by trade and shift. Track both quantity and quality reports that lead to corrective actions are more meaningful than volume alone.
2. Safety Training Completion Rate
Competency is the foundation of safe behaviour. This workplace safety metric tracks whether every worker on site holds current, role-specific certifications from fall protection and confined space entry to equipment operation and first aid. Overdue or expired training is a direct upstream risk.
What to measure: Percentage of the workforce with up-to-date training certifications, percentage of task-specific training completed before task commencement, and time-to-retrain after a safety event.
3. Toolbox Talk Frequency and Quality
Toolbox talks are the daily heartbeat of site safety communication. But frequency alone is not enough. A five-minute talk read from a script with no worker interaction is far less effective than a brief, focused discussion about the actual risks of the day’s work.
What to measure: Talks conducted versus planned, worker attendance rates, and qualitative feedback on relevance. Some leading firms now score talks on engagement – did workers ask questions? Were site-specific hazards discussed?
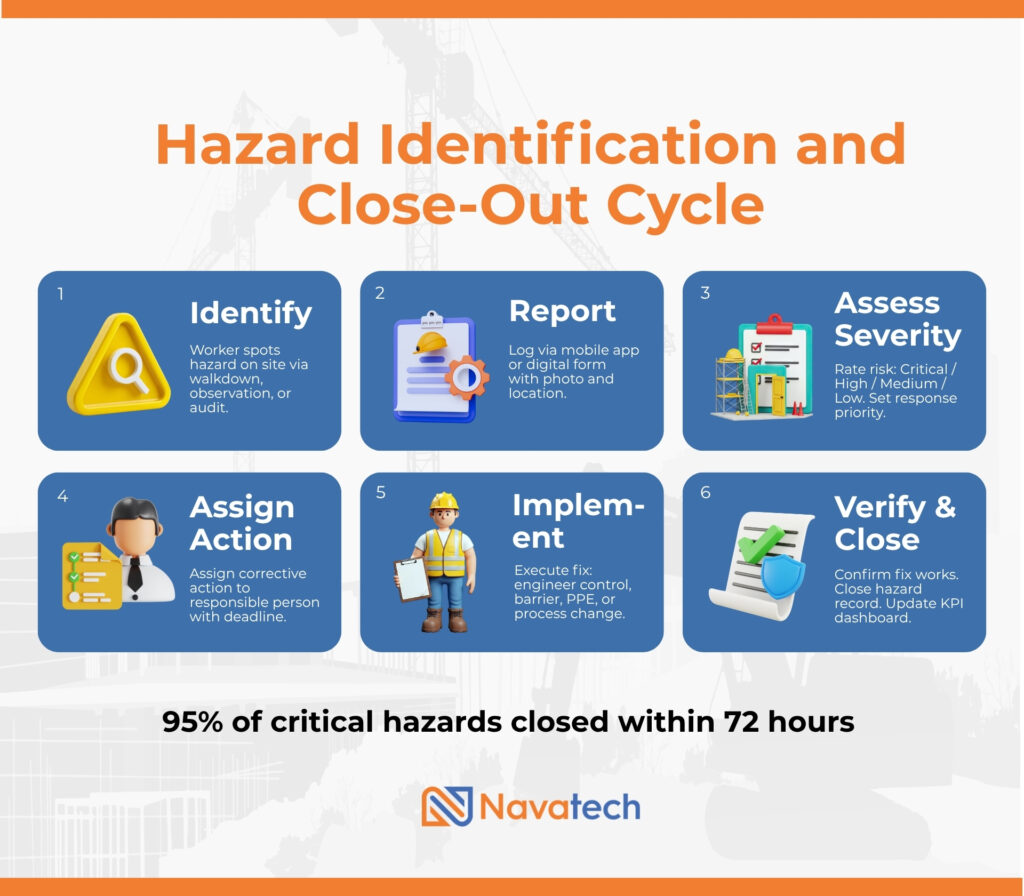
4. Hazard Identification and Close-Out Time
Identifying a hazard is only half the battle. The real measure of a site’s safety culture is how fast that hazard gets resolved. A site that identifies 50 hazards a week but closes only 10 is accumulating uncontrolled risk. This is a critical safety performance indicator for any construction site safety audit.
What to measure: Average days from hazard identification to verified close-out, percentage of hazards resolved within the target window (typically 24 to 72 hours for critical items), and recurring hazard trends.
5. Behavioural Safety Observation Rate
Behavioural observations allow supervisors and safety officers to identify at-risk actions – improper lifting, missing PPE, shortcuts on scaffolding – before they cause injuries. The observation rate reflects how actively a site is scanning for human-factor risks.
What to measure: Number of formal behavioural observations per supervisor per week, ratio of safe-to-unsafe behaviours observed, and trend analysis on the most frequent at-risk categories.
6. PPE Compliance Rate
Personal Protective Equipment remains the last line of defence on any construction site. While it should never replace engineering or administrative controls, consistent PPE use is a visible, measurable workplace safety metric that reflects a workforce’s safety discipline.
What to measure: Percentage of workers observed using correct PPE for the task, non-compliance incidents logged per inspection, and trends by trade or zone.
7. Safety Audit Completion Rate
Scheduled safety audits provide a structured, systematic check on whether controls are working as designed. Missed or delayed audits create blind spots – periods where risks may escalate without detection. This is a core HSE manager KPI that must be tracked consistently.
What to measure: Planned audits versus completed audits (expressed as a percentage), average time between scheduled and actual audit dates, and the ratio of findings per audit over time.
8. Permit-to-Work Compliance
High-risk activities – hot work, working at height, confined space entry, electrical isolation – require formal permits to ensure that adequate precautions are in place before work begins. Non-compliance with the permit-to-work system is one of the most reliable predictors of serious incidents.
What to measure: Percentage of high-risk tasks started with valid, approved permits, permit close-out rates within the required time frame, and instances of work proceeding without required permits.
9. Worker Fatigue and Wellness Index
Fatigue is an often-overlooked safety risk in construction, where long shifts, physical demands, and harsh conditions take a cumulative toll. Research from the Campbell Institute identifies health and wellness indicators as a direct contributor to safety performance.
[Source: Campbell Institute – Leading Indicators for Health & Wellbeing]
What to measure: Average weekly hours worked per employee, rest-period compliance, voluntary wellness programme participation, and self-reported fatigue or stress flags captured through digital check-ins.
10. Emergency Drill Effectiveness Score
Running drills is common. Running effective drills is rare. This indicator moves beyond simply counting drills and assesses whether the site’s emergency response actually works when tested – evacuation times, communication clarity, muster accuracy, and post-drill debrief quality.
What to measure: Drills completed versus planned, evacuation time against target, worker muster accuracy, and the number of improvement actions generated and closed from debrief sessions.
From Reporting Incidents to Preventing Them
The best HSE teams in 2026 will not be defined by how well they report incidents after the fact. They will be defined by how early they can see risk, how quickly they can respond, and how consistently they can strengthen controls before harm occurs.
That is the real value of construction safety KPIs. Not more dashboards for the sake of dashboards. Not more paperwork disguised as safety management. But clearer signals. Faster decisions. Better protection for workers on the ground.
For HSE managers, the shift is simple in principle, even if execution takes discipline: stop relying only on rearview-mirror metrics and start measuring the conditions that shape safety outcomes every day. Near-miss reporting, hazard close-out time, permit compliance, training readiness, and workforce fatigue are not just operational measures. They are leading indicators of whether your safety system is truly working.
For organisations operating across complex, multilingual, high-risk environments, this is where digital safety workflows become critical. When reporting is easy, data is structured, and corrective actions are visible in real time, leading indicators become far more than compliance metrics. They become a practical way to run safer, more responsive sites at scale.
At Navatech, we believe the future of construction safety lies in making these signals easier to capture, easier to understand, and easier to act on, through AI-powered, frontline-friendly workflows that fit how work actually happens on site. That is how safety moves from reactive reporting to proactive prevention.